Opster Team
Before you begin reading this guide, we recommend you run Elasticsearch Error Check-Up which analyzes 2 JSON files to detect many errors.
Briefly, this error message is indicating that writing the cluster state, which is a representation of the current state of the Elasticsearch cluster, took longer than the specified warning threshold. This can be caused by various factors such as slow disk I/O, network latency, or insufficient cluster resources. To resolve this issue, you should monitor the cluster performance and identify the root cause of the slow cluster state write.
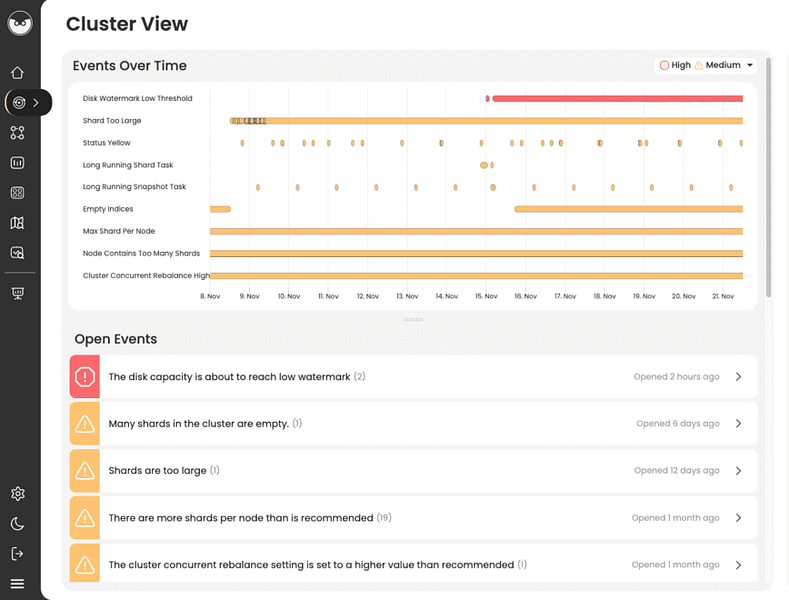
To easily locate the root cause and resolve this issue try AutoOps for Elasticsearch & OpenSearch. It diagnoses problems by analyzing hundreds of metrics collected by a lightweight agent and offers guidance for resolving them. Take a self-guided product tour to see for yourself (no registration required).
This guide will help you check for common problems that cause the log ” Writing cluster state took ms which is above the warn threshold of . ” to appear. To understand the issues related to this log, read the explanation below about the following Elasticsearch concepts: cluster.
Overview
An Elasticsearch cluster consists of a number of servers (nodes) working together as one. Clustering is a technology which enables Elasticsearch to scale up to hundreds of nodes that together are able to store many terabytes of data and respond coherently to large numbers of requests at the same time.
Search or indexing requests will usually be load-balanced across the Elasticsearch data nodes, and the node that receives the request will relay requests to other nodes as necessary and coordinate the response back to the user.
Notes and good things to know
The key elements to clustering are:
Cluster State – Refers to information about which indices are in the cluster, their data mappings and other information that must be shared between all the nodes to ensure that all operations across the cluster are coherent.
Master Node – Each cluster must elect a single master node responsible for coordinating the cluster and ensuring that each node contains an up-to-date copy of the cluster state.
Cluster Formation – Elasticsearch requires a set of configurations to determine how the cluster is formed, which nodes can join the cluster, and how the nodes collectively elect a master node responsible for controlling the cluster state. These configurations are usually held in the elasticsearch.yml config file, environment variables on the node, or within the cluster state.
Node Roles – In small clusters it is common for all nodes to fill all roles; all nodes can store data, become master nodes or process ingestion pipelines. However as the cluster grows, it is common to allocate specific roles to specific nodes in order to simplify configuration and to make operation more efficient. In particular, it is common to define a limited number of dedicated master nodes.
Replication – Data may be replicated across a number of data nodes. This means that if one node goes down, data is not lost. It also means that a search request can be dealt with by more than one node.
Common problems
Many Elasticsearch problems are caused by operations which place an excessive burden on the cluster because they require an excessive amount of information to be held and transmitted between the nodes as part of the cluster state. For example:
- Shards too small
- Too many fields (field explosion)
Problems may also be caused by inadequate configurations causing situations where the Elasticsearch cluster is unable to safely elect a Master node. This situation is discussed further in:
Backups
Because Elasticsearch is a clustered technology, it is not sufficient to have backups of each node’s data directory. This is because the backups will have been made at different times and so there may not be complete coherency between them. As such, the only way to backup an Elasticsearch cluster is through the use of snapshots, which contain the full picture of an index at any one time.
Cluster resilience
When designing an Elasticsearch cluster, it is important to think about cluster resilience. In particular – what happens when a single node goes down? And for larger clusters where several nodes may share common services such as a network or power supply – what happens if that network or power supply goes down? This is where it is useful to ensure that the master eligible nodes are spread across availability zones, and to use shard allocation awareness to ensure that shards are spread across different racks or availability zones in your data center.
Log Context
Log “writing cluster state took [{}ms] which is above the warn threshold of [{}];” classname is PersistedClusterStateService.java.
We extracted the following from Elasticsearch source code for those seeking an in-depth context :
                 commit(currentTerm; clusterState.version());
                fullStateWritten = true;
                final long durationMillis = relativeTimeMillisSupplier.getAsLong() - startTimeMillis;
                final TimeValue finalSlowWriteLoggingThreshold = slowWriteLoggingThresholdSupplier.get();
                if (durationMillis >= finalSlowWriteLoggingThreshold.getMillis()) {
                    logger.warn("writing cluster state took [{}ms] which is above the warn threshold of [{}]; " +
                            "wrote full state with [{}] indices";
                        durationMillis; finalSlowWriteLoggingThreshold; stats.numIndicesUpdated);
                } else {
                    logger.debug("writing cluster state took [{}ms]; " +
                            "wrote full state with [{}] indices";
Find & fix Elasticsearch problems
Opster AutoOps diagnoses & fixes issues in Elasticsearch based on analyzing hundreds of metrics.
Fix Your Cluster IssuesConnect in under 2 minutes

Billy McCarthy
Senior SysAdmin at Backblaze


