
Published on : November 2019
Elasticsearch is an incredibly popular search engine that can be used to store, search, and analyze a vast amount of information in near real time. Although its initial setup is very easy, Elasticsearch can become surprisingly difficult to manage over time. As the Elasticsearch cluster begins to scale, it can behave in unexpected ways, leading to nightmarish problems that are extremely challenging to solve. Forums are overflowing with perplexed developers seeking guidance for addressing specific problems, such as unassigned shards and lost data nodes, as well as systemic issues such as slow searches, indexing bottlenecks, and crashing clusters.
Memory-intensive Queries
Instacart, an American grocery and delivery and pick-up service, has created a huge digital catalog of grocery items that is constantly updated and accessible to consumers through both mobile and web applications. Elasticsearch is at the core of their operations, storing nearly 600 million searchable items that are updated approximately 750 times per second.
In early 2018, Instacart’s platform began exhibiting severe performance problems. The app registered tens of thousands of errors per day, Elasticsearch queries failed, and the site often went down during peak activity. The IT staff could see that Elasticsearch was running slowly and causing both errors and increased latency, but they had no way to identify why this was happening. Consequently, the company developed an Elasticsearch monitoring tool called ESHero. It revealed that the clusters overall were healthy, with the exception of a few frequently used and badly coded queries that were slowing things down. Once the queries were optimized, the number of time-outs per day was reduced from 60,000 to about 2000.
This case study demonstrates what a huge impact complex and heavy queries can have on Elasticsearch performance, pointing to the importance of query optimization. To prevent incidents like this, Elasticsearch users should have a reliable method for scanning and monitoring query performance.
Crashing Data Nodes
Plaid, a Fintech company based in San Francisco, relies heavily on its Amazon-hosted Elasticsearch for real-time log analysis. Elasticsearch is one of Plaid’s most widely used internal systems and is therefore crucial to the work of many of its teams. In March 2019, many Elasticsearch nodes died, leading to outages that took hours for the company to recover from. During this time, Elasticsearch was unqueryable. The graph below shows dying nodes during a typical outage:
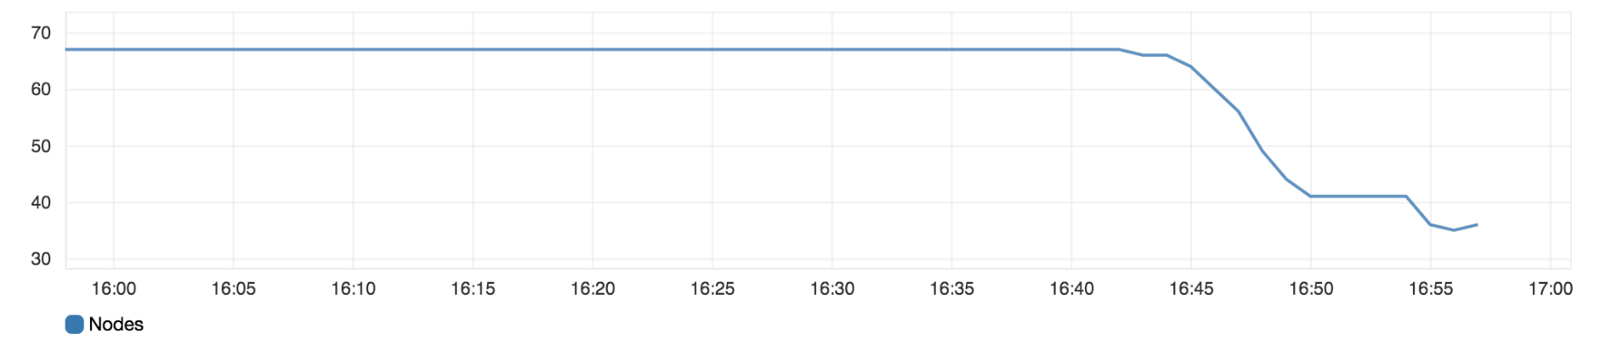
This situation lasted for over two weeks. All that could be determined was that there were JVM memory pressure spikes on the crashing data nodes. After ruling out other theories, Plaid staff correctly hypothesized that the root of the problem was memory-intensive search queries.
Detecting these queries was nearly impossible, because, when the cluster was affected by a certain query, other queries’ performance would be affected as well. What made matters even worse was that queries that failed to complete didn’t show up in the company’s logs at all. The queries that were bringing down the system were hiding in uncharted territory, crashing the nodes with no warning. Although Plaid had enabled error logs, search slow logs, and index slow logs on their Elasticsearch domain, the relevant logs were not available in the AWS console. After finally getting access to them through AWS, Plaid identified the user-written queries that were aggregating over a large number of buckets. These queries forced Elasticsearch to keep an individual counter of millions of unique keys, a process which used up their memory and crashed the entire system
Once the root cause was identified, the problem could be fixed with two straightforward changes. First, Plaid capped the memory usage of individual queries by reconfiguring their memory circuit breakers and limiting the indices.breaker.request.limit to 40%. Next, the number of buckets used for aggregations was limited by setting the search.max_buckets to 10000.
Plaid’s ordeal demonstrates that AWS Elasticsearch users should actively request access to potentially critical raw logs because log observability is critical for root cause analysis.
Garbage Collection Hell
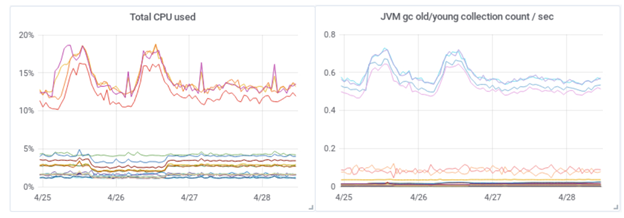
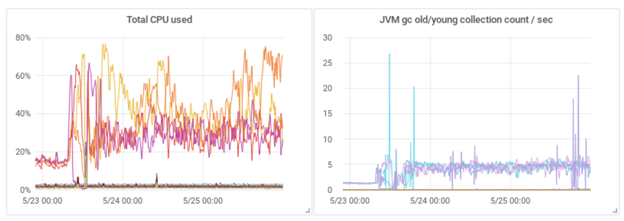
An Emc2Net blog post detailed an incident that occurred after the company updated an Elasticsearch cluster from version 5.6.16 to 6.7.1. The update led to a huge degradation in performance, with routine operations slowing down unbearably. The new version used five times more resources than the previous version. The cluster’s CPU went through the roof, operating at 80-90% of their 48CPU capacity, and their Java heap became clogged.
The following graphs compare the CPU and JVM activity from before the update (above) and after (below):
The staff was bewildered by these events, because the amount of data hadn’t changed, the network and disk activity were normal, and the number of searches had stayed the same. They spent many hours looking through documentation as well as blogs and forums without finding any explanation for the frustrating effects they were witnessing.
To solve the problem, the team went through a long process of trial and error. At one point, they discovered that, after the upgrade, their young memory pool was only using 2G out of the available 31G, and yet it had five times the garbage collection (GC) count as before. Resolving this required changing the default JVM values. So, they altered their ParallelGCThreads value, changed the size ratio between young and old memory pools, allotted more memory to shards by increasing the indices.memory.index_buffer_size to 20%, and increased the index.refresh_interval to 30 seconds. These changes dramatically reduced CPU and GC/sec, returning performance to a stable and predictable state. This fix was achieved after extremely time-consuming experimentation, and the team never really got to the bottom of what had happened.
This story offers up some key takeaways. First, before upgrading versions, it’s advisable to first run an upgrade procedure in a staging environment. Second, memory management is complex, and default configurations may be working against you. Lastly, and most importantly, things can go terribly wrong in Elasticsearch incredibly quickly. Sometimes, these incidents are resolved upon restart or over time, but, in order to solve them effectively, you need good system observability that allows you to detect underlying causes and optimize your configurations ahead of time.
Security Breaches
In July 2019, Honda, the giant automobile manufacturer, accidently exposed an Elasticsearch database with 40GB of data (roughly 134 million documents) as a result of misconfigured permissions and poor employee training. The exposed database contained highly sensitive information about Honda’s internal networks and computers, including information regarding one of the major security vendors that protects Honda’s machines.
Honda’s data breach figures into a much more widespread problem. In 2019, multiple other Elasticsearch databases were also compromised. In September 2019, it was revealed that the private information of 2.5 million Yves Rocher customers was exposed on an unsecure Elasticsearch database. In August 2019, Chile’s Electoral Service affirmed that the sensitive voter information of over 14.3 million citizens was similarly leaked. In January 2019, over 24 million financial US bank records were temporarily exposed on an open Elasticsearch server. These examples only begin to illustrate the magnitude of the problem.
This epidemic is no coincidence. It is not enough to rely on Elasticsearch’s built-in security and default settings. Elasticsearch users must take concrete steps to avoid exposing their rest API to the public internet and subjecting their data to theft or corruption. Users should actively follow best practices as well as community guidelines and recommendations, configuring their security settings so that data is encrypted in-flight and at-rest and making sure everything is always up-to-date.
Lack of Automation
Sometimes, problems with Elasticsearch can arise at particularly inopportune times. At Kickstarter, the American crowdfunding platform, developers were once awakened in the middle of the night because of a problem with refilling Elasticsearch indexes. This problem had occurred many times before, and fixing it required running just one line of code.
Although this problem was easily identified and fixed, it continued to recur. This story calls attention to the importance of automating workflows and actively automating manual repetitive tasks. This particular case could have been avoided by monitoring Elasticsearch indices and ensuring that they were tuned regularly for optimal performance. Keep in mind that the open-source version of Elasticsearch does not come with built-in UI for these operations. There are some commercially available limited and ad-hoc solutions that can help address this specific problem, like Elastic’s indices lifecycle management policy and Open Distro’s indexing automation.
Although Kickstarter suffered no devastating effects from this incident, this anecdote should serve as a reminder that operation automation should not be neglected. Even if you have a known problem that is easy to solve, it will keep popping up at inconvenient times if you don’t fix its root cause (and, with Murphy’s help, the problem would probably occur during peak user usage with the new on-call developer!).
Summary
Most of the time, Elasticsearch does a fantastic job, operating quietly behind the scenes to power thousands of applications. Sometimes, however, things can go very wrong very quickly. The once quiet Elasticsearch can come crashing down with a bang, not only keeping you up at night, but also compromising sensitive company data, disrupting the customer experience, and potentially having a significant negative impact on your business.