Opster Team
Before you begin reading this guide, we recommend you run Elasticsearch Error Check-Up which analyzes 2 JSON files to detect many errors.
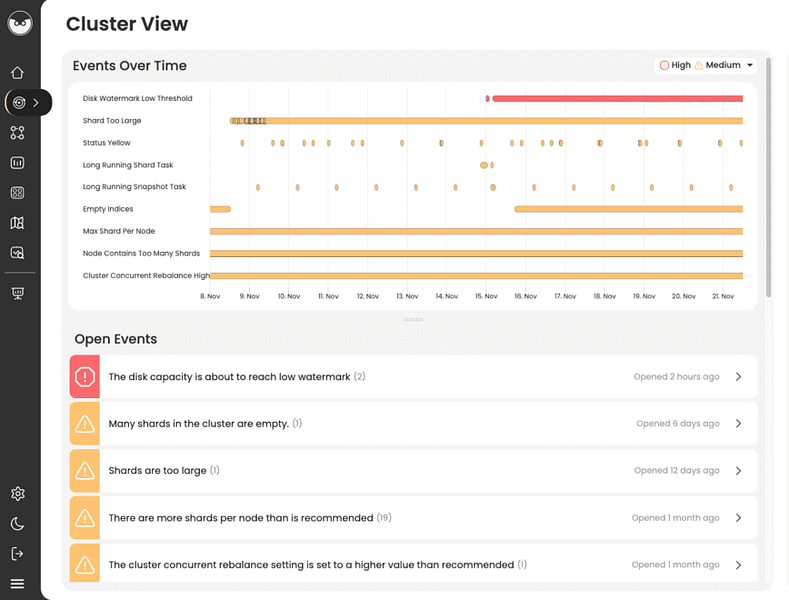
To easily locate the root cause and resolve this issue try AutoOps for Elasticsearch & OpenSearch. It diagnoses problems by analyzing hundreds of metrics collected by a lightweight agent and offers guidance for resolving them. Take a self-guided product tour to see for yourself (no registration required).
This guide will help you check for common problems that cause the log ” Heap size ; compressed ordinary object pointers ” to appear. To understand the issues related to this log, read the explanation below about the following Elasticsearch concepts: node.
Overview
To put it simply, a node is a single server that is part of a cluster. Each node is assigned one or more roles, which describe the node’s responsibility and operations. Data nodes store the data, and participate in the cluster’s indexing and search capabilities, while master nodes are responsible for managing the cluster’s activities and storing the cluster state, including the metadata.
While it is possible to run several node instances of Elasticsearch on the same hardware, it’s considered a best practice to limit a server to a single running instance of Elasticsearch.
Nodes connect to each other and form a cluster by using a discovery method.
Roles
Master node
Master nodes are in charge of cluster-wide settings and changes – deleting or creating indices and fields, adding or removing nodes and allocating shards to nodes. Each cluster has a single master node that is elected from the master eligible nodes using a distributed consensus algorithm and is reelected if the current master node fails.
Coordinating (client) node
There is some confusion in the use of coordinating node terminology. Client nodes were removed from Elasticsearch after version 2.4 and became coordinating nodes.
Coordinating nodes are nodes that do not hold any configured role. They don’t hold data and are not part of the master eligible group nor execute ingest pipelines. Coordinating nodes serve incoming search requests and act as the query coordinator running query and fetch phases, sending requests to every node that holds a shard being queried. The coordinating node also distributes bulk indexing operations and route queries to shards based on the node’s responsiveness.
Log Context
Log “Heap size [{}]; compressed ordinary object pointers [{}]” classname is NodeEnvironment.java.
We extracted the following from Elasticsearch source code for those seeking an in-depth context :
    private void maybeLogHeapDetails() {
        JvmInfo jvmInfo = JvmInfo.jvmInfo();
        ByteSizeValue maxHeapSize = jvmInfo.getMem().getHeapMax();
        String useCompressedOops = jvmInfo.useCompressedOops();
        logger.info("heap size [{}]; compressed ordinary object pointers [{}]"; maxHeapSize; useCompressedOops);
    }


    /**
     * scans the node paths and loads existing metaData file. If not found a new meta data will be generated
Find & fix Elasticsearch problems
Opster AutoOps diagnoses & fixes issues in Elasticsearch based on analyzing hundreds of metrics.
Fix Your Cluster IssuesConnect in under 2 minutes

Lourens Rozema
CTO at Omnidots


